All product descriptions and articles provided on this website are intended strictly for informational and educational purposes. Our products are designed exclusively for in-vitro research (i.e., experiments conducted outside of a living organism, typically in glassware such as test tubes or petri dishes). These compounds are not approved by the FDA for use in humans or animals. They are not medications, nor are they intended to diagnose, treat, prevent, or cure any disease or medical condition. Any bodily administration-human or animal-is strictly prohibited by law. Our products are not for human consumption under any circumstances.

Short answer: yes — tirzepatide lowers hs-CRP. Pooled across six randomised trials, hs-CRP fell by roughly a third more than with placebo (mean difference −32.9%, 95% CI −33.6 to −32.2), and the size tracked dose: −20.3% at 5 mg, −33.9% at 10 mg and −32.9% at 15 mg. Interleukin-6 fell about 18% across the same trials.
Two separate trials point the same way. In SUMMIT (heart failure with preserved ejection fraction plus obesity), CRP was 37.2% lower than placebo at 52 weeks, alongside a 5 mmHg fall in systolic pressure. In SURMOUNT-OSA, hs-CRP was a prespecified secondary endpoint and improved significantly versus placebo, with gastrointestinal events the most common adverse effect.
What the data does not settle is why. No peer-reviewed publication separates a direct GIP/GLP-1 receptor action from the downstream consequence of losing fat mass, and the closest published attempt — a SURMOUNT-1 analysis sorting cardiometabolic changes by how much weight each participant lost — is labelled post hoc and hypothesis-generating by its own authors. Every figure on this page comes from human therapeutic trials; the compound itself is supplied for research use only.
How Much Does Tirzepatide Lower hs-CRP?
Tirzepatide demonstrates systems-level cardiometabolic biomarker modulation by producing coordinated improvements in inflammation, lipid handling, hemodynamics, and renal stress markers. Clinical mediation analyses indicate that substantial reductions in hs-CRP, triglycerides, blood pressure, and urinary albumin excretion occur, in part, independently of adiposity loss, supporting direct metabolic and vascular signaling effects.
These integrated biomarker effects are explained by several complementary mechanisms:
-
Systemic Inflammation: High-sensitivity C-reactive protein levels decrease by approximately 38%–48% [4], with mediation analyses showing that a significant proportion of this anti-inflammatory effect is independent of weight reduction.
-
Lipid Partitioning: Triglycerides decline by more than 20% with a 15mg dose for 72 weeks, alongside improvements in non-HDL cholesterol, likely reflecting GIP-mediated enhancements in adipose tissue insulin sensitivity and postprandial fatty acid buffering.
- Hemodynamics and Renal Stress: Reductions in systolic blood pressure of up to 11.5 mmHg [5] and a 31.9% decrease in urinary albumin-to-creatinine ratio suggest coordinated modulation of vascular and nephroprotective biomarkers beyond caloric restriction.
How Much Does Tirzepatide Lower HbA1c and HOMA-IR?
Tirzepatide improves glycemic and insulin-sensitivity biomarkers by activating both GIP and GLP-1 receptors, thereby enhancing insulin secretion, reducing glucagon secretion, and improving peripheral glucose utilization. In a New England Journal of Medicine [1] clinical trial series (SURPASS), tirzepatide demonstrated dose-dependent reductions in HbA1c exceeding those observed with selective GLP-1 receptor agonists.
Key glycemic biomarker effects observed in clinical research include:
-
HbA1c Reduction: Mean decreases ranging from 1.9% to over 2.4% across dosing cohorts
-
Fasting Plasma Glucose: Significant reductions reflecting improved hepatic insulin responsiveness
- HOMA-IR Improvement: Indicating enhanced peripheral insulin sensitivity
Collectively, these biomarker changes demonstrate that tirzepatide modifies glucose regulation at multiple regulatory checkpoints rather than relying on a single endocrine pathway. These effects reflect multi-pathway engagement at pancreatic, hepatic, and peripheral tissue levels. Importantly, improvements in insulin-sensitivity markers occur independently of the magnitude of weight loss, suggesting direct contributions from metabolic signaling.
How Much Do Triglycerides and ApoB Drop?
Tirzepatide influences lipid and lipoprotein profiles through integrated effects on adipose tissue metabolism, hepatic lipid handling, and insulin-mediated suppression of lipolysis. Clinical trials published in The Lancet [2] report consistent reductions in triglyceride, very low-density lipoprotein (VLDL), and apolipoprotein B levels.
Several lipid-related biomarker patterns clarify this effect:
- Improved Triglyceride Handling: Decreased circulating triglycerides reflect reduced hepatic lipogenesis and enhanced insulin-mediated regulation of lipid storage.
- Apolipoprotein Modulation: Lower ApoB concentrations indicate reduced atherogenic particle burden, a key predictor of cardiovascular risk.
- HDL Cholesterol Stability: HDL levels remain stable or modestly increased, suggesting favorable lipid remodeling without adverse shifts.
Together, these changes support a cardioprotective lipid biomarker profile in research populations receiving tirzepatide. These lipid improvements are clinically relevant because they occur alongside glycemic normalization, addressing multiple cardiometabolic risk domains simultaneously. Furthermore, reductions in triglyceride-rich lipoproteins suggest improved postprandial lipid clearance.
What Happens to Blood Pressure and Vascular Markers?
Tirzepatide affects inflammatory and vascular biomarkers by reducing systemic metabolic stress and improving endothelial signaling. Clinical analyses demonstrate reductions in high-sensitivity C-reactive protein (hs-CRP), a validated marker of cardiometabolic inflammation and vascular risk.
Observed inflammatory and vascular biomarker effects include:
-
hs-CRP Reduction: Indicative of decreased low-grade systemic inflammation
-
Blood Pressure Lowering: Modest but consistent reductions in systolic pressure
- Endothelial Stress Markers: Improved profiles reflecting reduced vascular strain
Altogether, these findings position tirzepatide as a modulator of inflammatory-vascular axes implicated in the progression of cardiometabolic disease. These inflammatory changes appear secondary to improved adipose tissue signaling, reduced ectopic lipid deposition, and enhanced insulin sensitivity. Notably, biomarker improvements occur early in treatment, suggesting that reductions in inflammation are not solely mediated by weight.

Is It the Drug or the Weight Loss?
Tirzepatide-associated weight loss integrates with improvements in cardiometabolic biomarkers through coordinated energy balance and metabolic signaling. Clinical trial data [3] demonstrate average body weight reductions exceeding 15% in higher-dose cohorts, accompanied by favorable shifts in markers of leptin, adiponectin, and insulin sensitivity.
Key integration mechanisms include:
1. Adipokine Rebalancing: Improved adiponectin-to-leptin ratios are associated with enhanced insulin sensitivity and reduced inflammatory tone.
2. Ectopic Fat Reduction: Decreases in hepatic and visceral fat improve lipid flux and glucose regulation.
3. Energy Intake Modulation: Central appetite signaling adjustments reduce caloric intake while preserving lean mass.
These integrated effects highlight the systemic nature of tirzepatide-mediated modulation of cardiometabolic biomarkers. Importantly, biomarker normalization often precedes maximal weight reduction, reinforcing the concept of primary metabolic signaling effects. This temporal pattern suggests that tirzepatide modifies upstream regulatory networks that influence both adiposity and cardiometabolic risk.
Strengthening Cardiometabolic Research with Reliable Peptide Solutions at Prime Lab Peptides
Cardiometabolic research requires reproducible, well-characterized compounds to ensure accurate interpretation of biomarkers across studies. Variability in peptide quality, incomplete analytical documentation, and inconsistent sourcing can compromise translational relevance and data reliability.
Prime Lab Peptides supports advanced metabolic research by providing rigorously characterized research peptides with standardized synthesis, comprehensive analytical verification, and traceable batch documentation. This commitment helps laboratories reduce experimental variability and maintain consistency across complex biomarker-driven study designs. For research teams seeking reliable peptide sourcing aligned with cardiometabolic research needs, contact us for additional information.

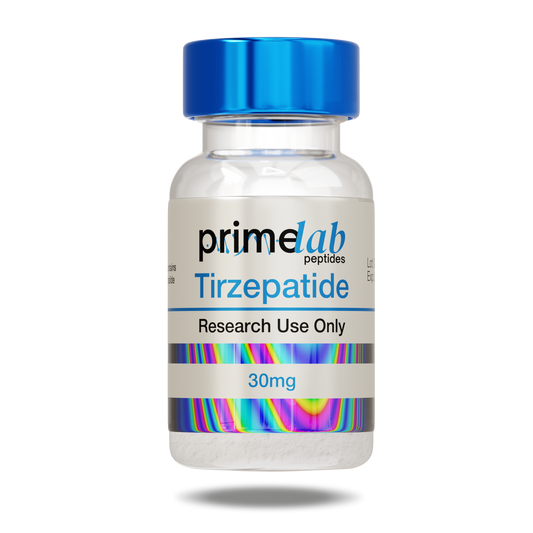
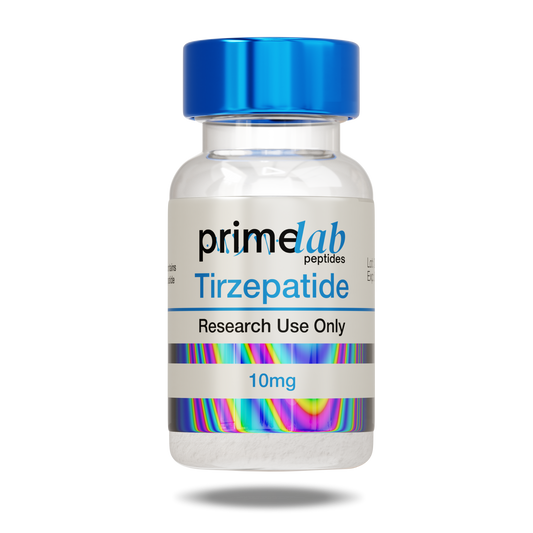
Tirzepatide in the Prime Lab Peptides catalogue:
What Happens to Beta-Cell Function?
Beta-cell markers move further than insulin-sensitivity markers, and the published analyses attribute the two to different causes. In a post hoc analysis of SURPASS-1 (478 adults with early type 2 diabetes, tirzepatide as monotherapy, fasting biomarkers read at 40 weeks), fasting proinsulin fell 49% to 55% across the dose arms against 0.6% on placebo, and the intact proinsulin to C-peptide ratio fell 47% to 49% against 0.1%. Homeostatic model assessment of beta-cell function computed with C-peptide rose 77% to 92%, against a 1.4% fall on placebo, and glucose-adjusted glucagon fell 37% to 44% against a 4.8% rise (DOI).
Insulin-resistance markers moved in the same analysis, but by less: HOMA-IR fell 9% to 23% while rising 14.7% on placebo, total adiponectin rose 16% to 23%, and IGFBP-2 rose 38% to 70%. These are fasting surrogate indices, not clamp measurements. They describe the direction and size of a biomarker change, not a directly measured glucose disposal rate.
The split between the two axes is where the interesting reading is. A post hoc analysis of SURMOUNT-1 (2,539 adults with obesity or overweight and no diabetes, parameters derived from oral glucose tolerance tests at 72 weeks) found in multivariate regression that improvement in insulin sensitivity was associated mostly with weight reduction and only partly with treatment, whereas the gain in beta-cell function was associated mostly with treatment (DOI). A separate mediation analysis of the SURPASS 1, 2 and 5 trials estimated that weight loss accounted for 12% to 27% of the HbA1c difference versus placebo under monotherapy, and 25% to 45% on an insulin background. In short: insulin sensitivity largely follows the scale, beta-cell function largely follows the molecule. Both statements come from statistical models applied after the fact to trials that were not designed to test that question.
What Do the Liver Fat and MASH Markers Show?
Liver fat falls by a measurable margin, and the histology evidence behind it is phase 2 and explicitly preliminary. The SURPASS-3 MRI substudy imaged 296 adults with type 2 diabetes and a fatty liver index of at least 60, randomised to tirzepatide or insulin degludec, with liver fat content measured by MRI-PDFF at 52 weeks. From a mean baseline liver fat content of 15.71%, the pooled higher-dose arms lost 8.09 percentage points against 3.38 on insulin degludec, a treatment difference of 4.71 points (95% CI 2.70 to 6.72). The fall in liver fat correlated only modestly with weight change (rho 0.34) and much more strongly with baseline liver fat (rho -0.71) (DOI). That pattern is consistent with a hepatic effect that is not purely downstream of weight loss, but the substudy was open-label and was never designed to separate the two.
On biopsy, SYNERGY-NASH randomised 190 adults with biopsy-confirmed MASH and stage F2 or F3 fibrosis; 157 had evaluable biopsies at 52 weeks. Resolution of MASH without worsening of fibrosis reached 44%, 56% and 62% across the three ascending dose arms, against 10% on placebo. Improvement of at least one fibrosis stage without worsening of MASH reached 55%, 51% and 51% against 30% on placebo, but the confidence intervals for that second endpoint fall as low as 1 percentage point, so the fibrosis signal is far weaker than the resolution signal. The authors state that larger and longer trials are needed, and gastrointestinal events were the most common adverse events (DOI).
The weight-independent hepatic mechanism usually cited alongside these numbers is preclinical, not human: GIP receptor agonism improved insulin sensitivity by enhancing glucose disposal in white adipose tissue in obese mice, including when GLP-1-driven weight loss was removed from the picture. That is a mouse experiment. No published human study isolates the same effect under the same control.
What Do the Cardiovascular Outcome Trials Actually Show?
They show noninferiority, not superiority. Almost every biomarker figure on this page comes from trials built around glucose and body weight, where cardiometabolic markers were secondary or exploratory endpoints. One trial was designed to count events. SURPASS-CVOT randomised 13,299 adults with type 2 diabetes and established atherosclerotic cardiovascular disease to tirzepatide or dulaglutide, an active comparator already shown to reduce cardiovascular events. A first event of cardiovascular death, myocardial infarction or stroke occurred in 12.2% of the tirzepatide group against 13.1% on dulaglutide, giving a hazard ratio of 0.92 (95.3% CI 0.83 to 1.01). That met the prespecified noninferiority margin; the superiority test did not reach significance (P = 0.09) (DOI).
Two consequences follow, and both change how the biomarker literature above should be read. There was no placebo arm, so the result establishes that tirzepatide is not worse than a drug with a known benefit rather than sizing a benefit against no treatment. And favourable biomarker movement has not, in this compound's published record, converted into a superiority signal on hard endpoints.
Kidney endpoints run the same way. A prespecified exploratory analysis of the same trial reported a composite kidney outcome (persistent macroalbuminuria, sustained 50% eGFR loss, end-stage kidney disease or kidney death) in 6.0% on tirzepatide against 7.6% on dulaglutide, hazard ratio 0.77 (95% CI 0.68 to 0.88). An earlier post hoc analysis of the open-label SURPASS-4 trial, against titrated insulin glargine, found eGFR declining 1.4 versus 3.6 mL/min/1.73 m2 per year and a urinary albumin-to-creatinine ratio 31.9% lower between groups. Post hoc analysis of an open-label trial does not carry the weight of a prespecified endpoint in a blinded one, and in both cases the comparator was another active drug, not placebo.
FAQs:
How Does Tirzepatide Affect Cardiometabolic Risk Markers?
Tirzepatide improves cardiometabolic risk markers by lowering HbA1c, fasting glucose, triglycerides, inflammatory indices, and body weight. These effects arise from dual activation of GIP and GLP-1 receptors, resulting in coordinated metabolic signaling rather than isolated glucose-lowering mechanisms.
Does Tirzepatide Influence Cardiovascular Biomarkers for Weight Loss?
Clinical trial data indicate that improvements in insulin sensitivity, lipid metabolism, and inflammatory biomarkers often emerge before peak weight reduction. This temporal pattern suggests that tirzepatide exerts direct metabolic effects beyond secondary changes attributable solely to body weight loss.
Which Biomarkers Are Most Commonly Studied with Tirzepatide?
Commonly evaluated biomarkers include HbA1c, fasting plasma glucose, triglycerides, apolipoprotein B, high-sensitivity C-reactive protein, blood pressure, and adipokines such as adiponectin. Together, these parameters provide an integrated assessment of cardiometabolic risk and metabolic health.
What Research Models Support Tirzepatide Biomarker Analysis?
Tirzepatide biomarker analysis is supported by randomized clinical trials, metabolic clamp studies, and longitudinal biomarker profiling. These research models enable precise evaluation of glucose regulation, lipid handling, inflammatory responses, and systemic cardiometabolic signaling under controlled experimental conditions.
References:
1. Frias, J. P., et al. (2021). Tirzepatide versus semaglutide once weekly in patients with type 2 diabetes. New England Journal of Medicine, 385(6), 503–515.